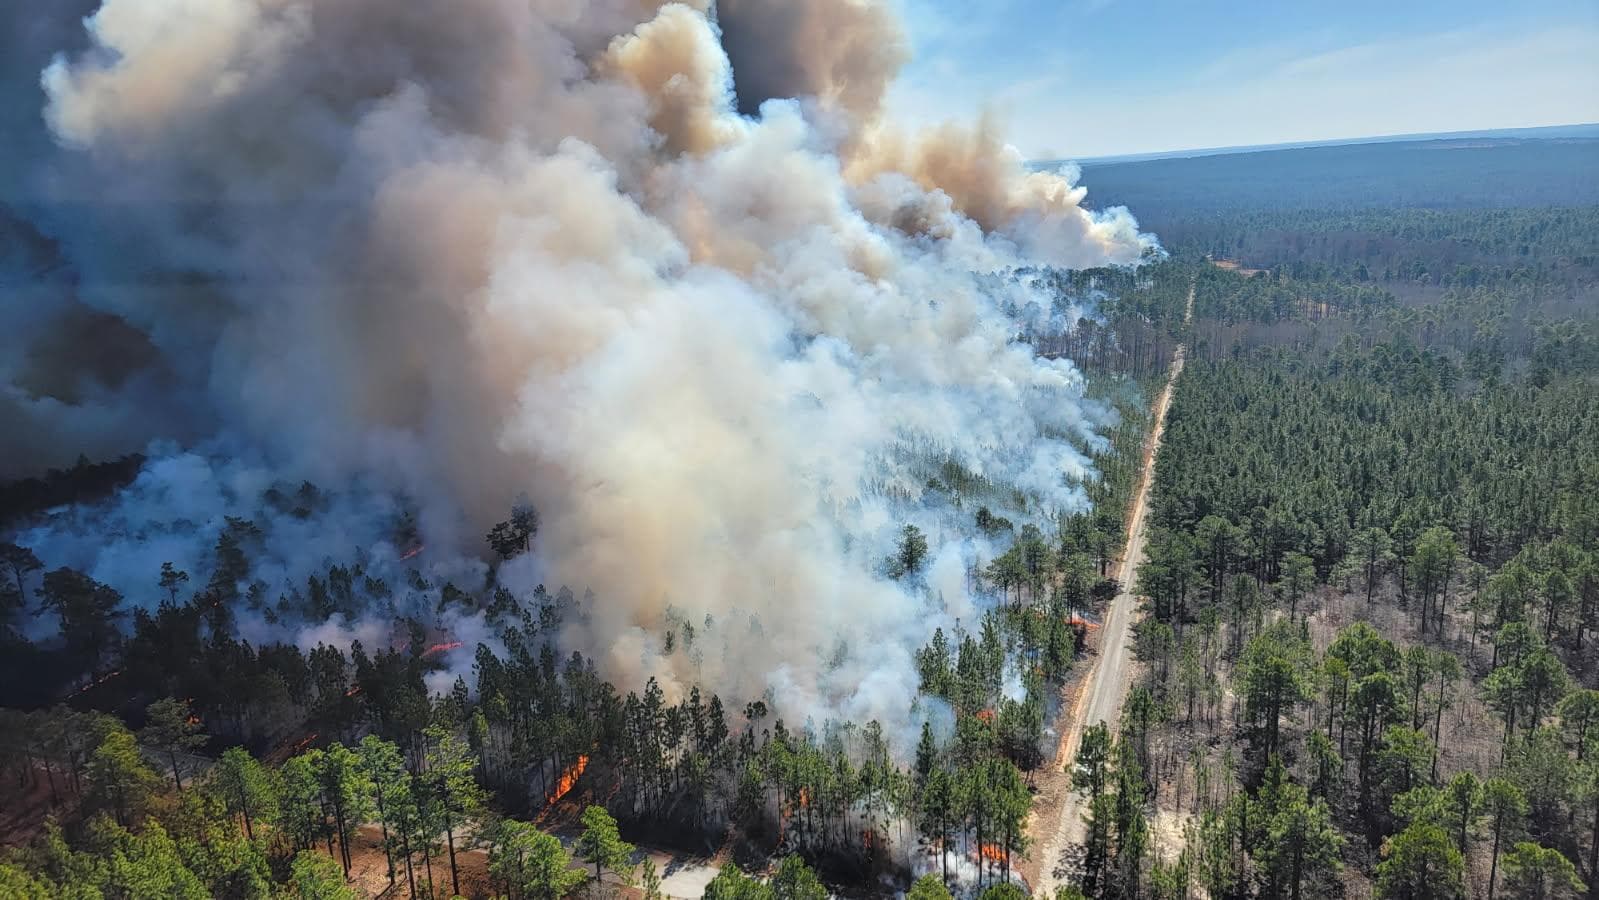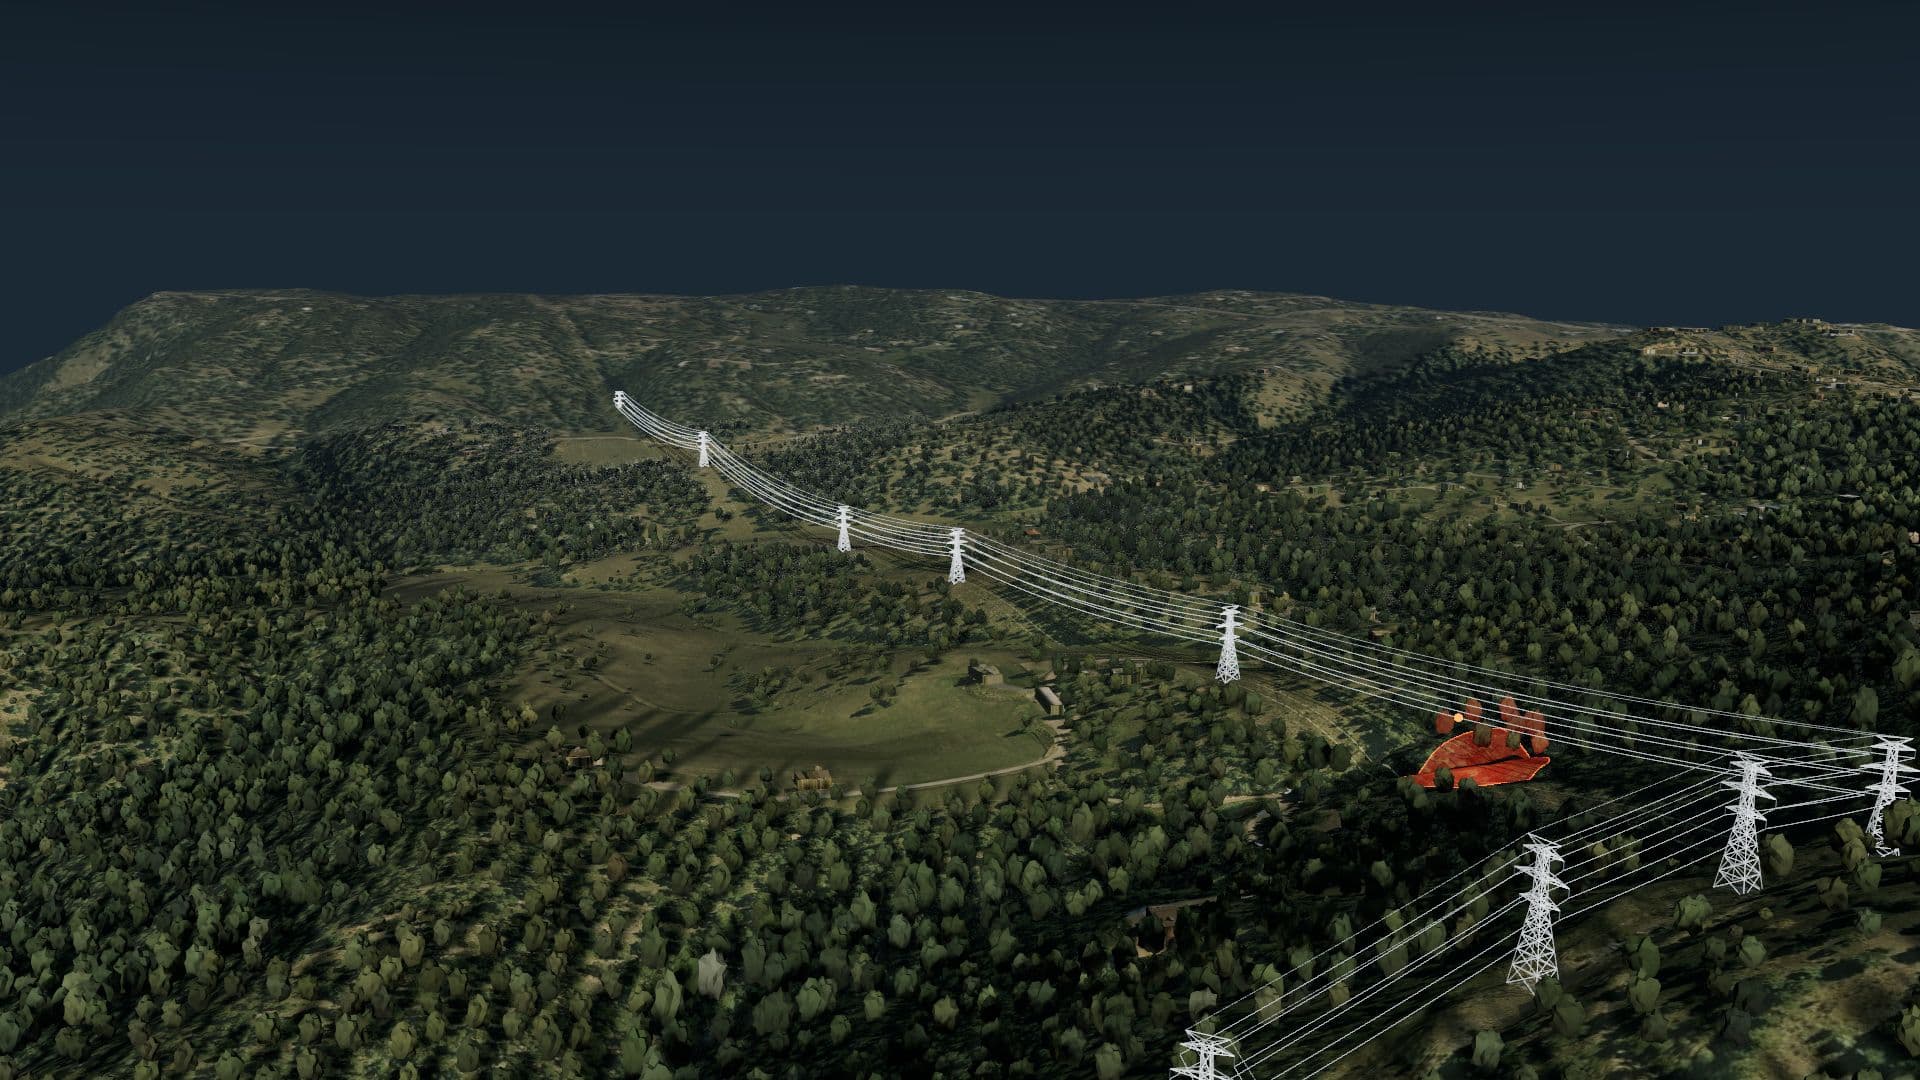
Know your wildfire risk before it becomes a threat.

The all in one wildfire risk solution that makes it easy to understand your current threats, potential risks, wildfire growth and behaviour. Built to serve all levels of wildfire expertise, from local knowledge, to enterprise operations.
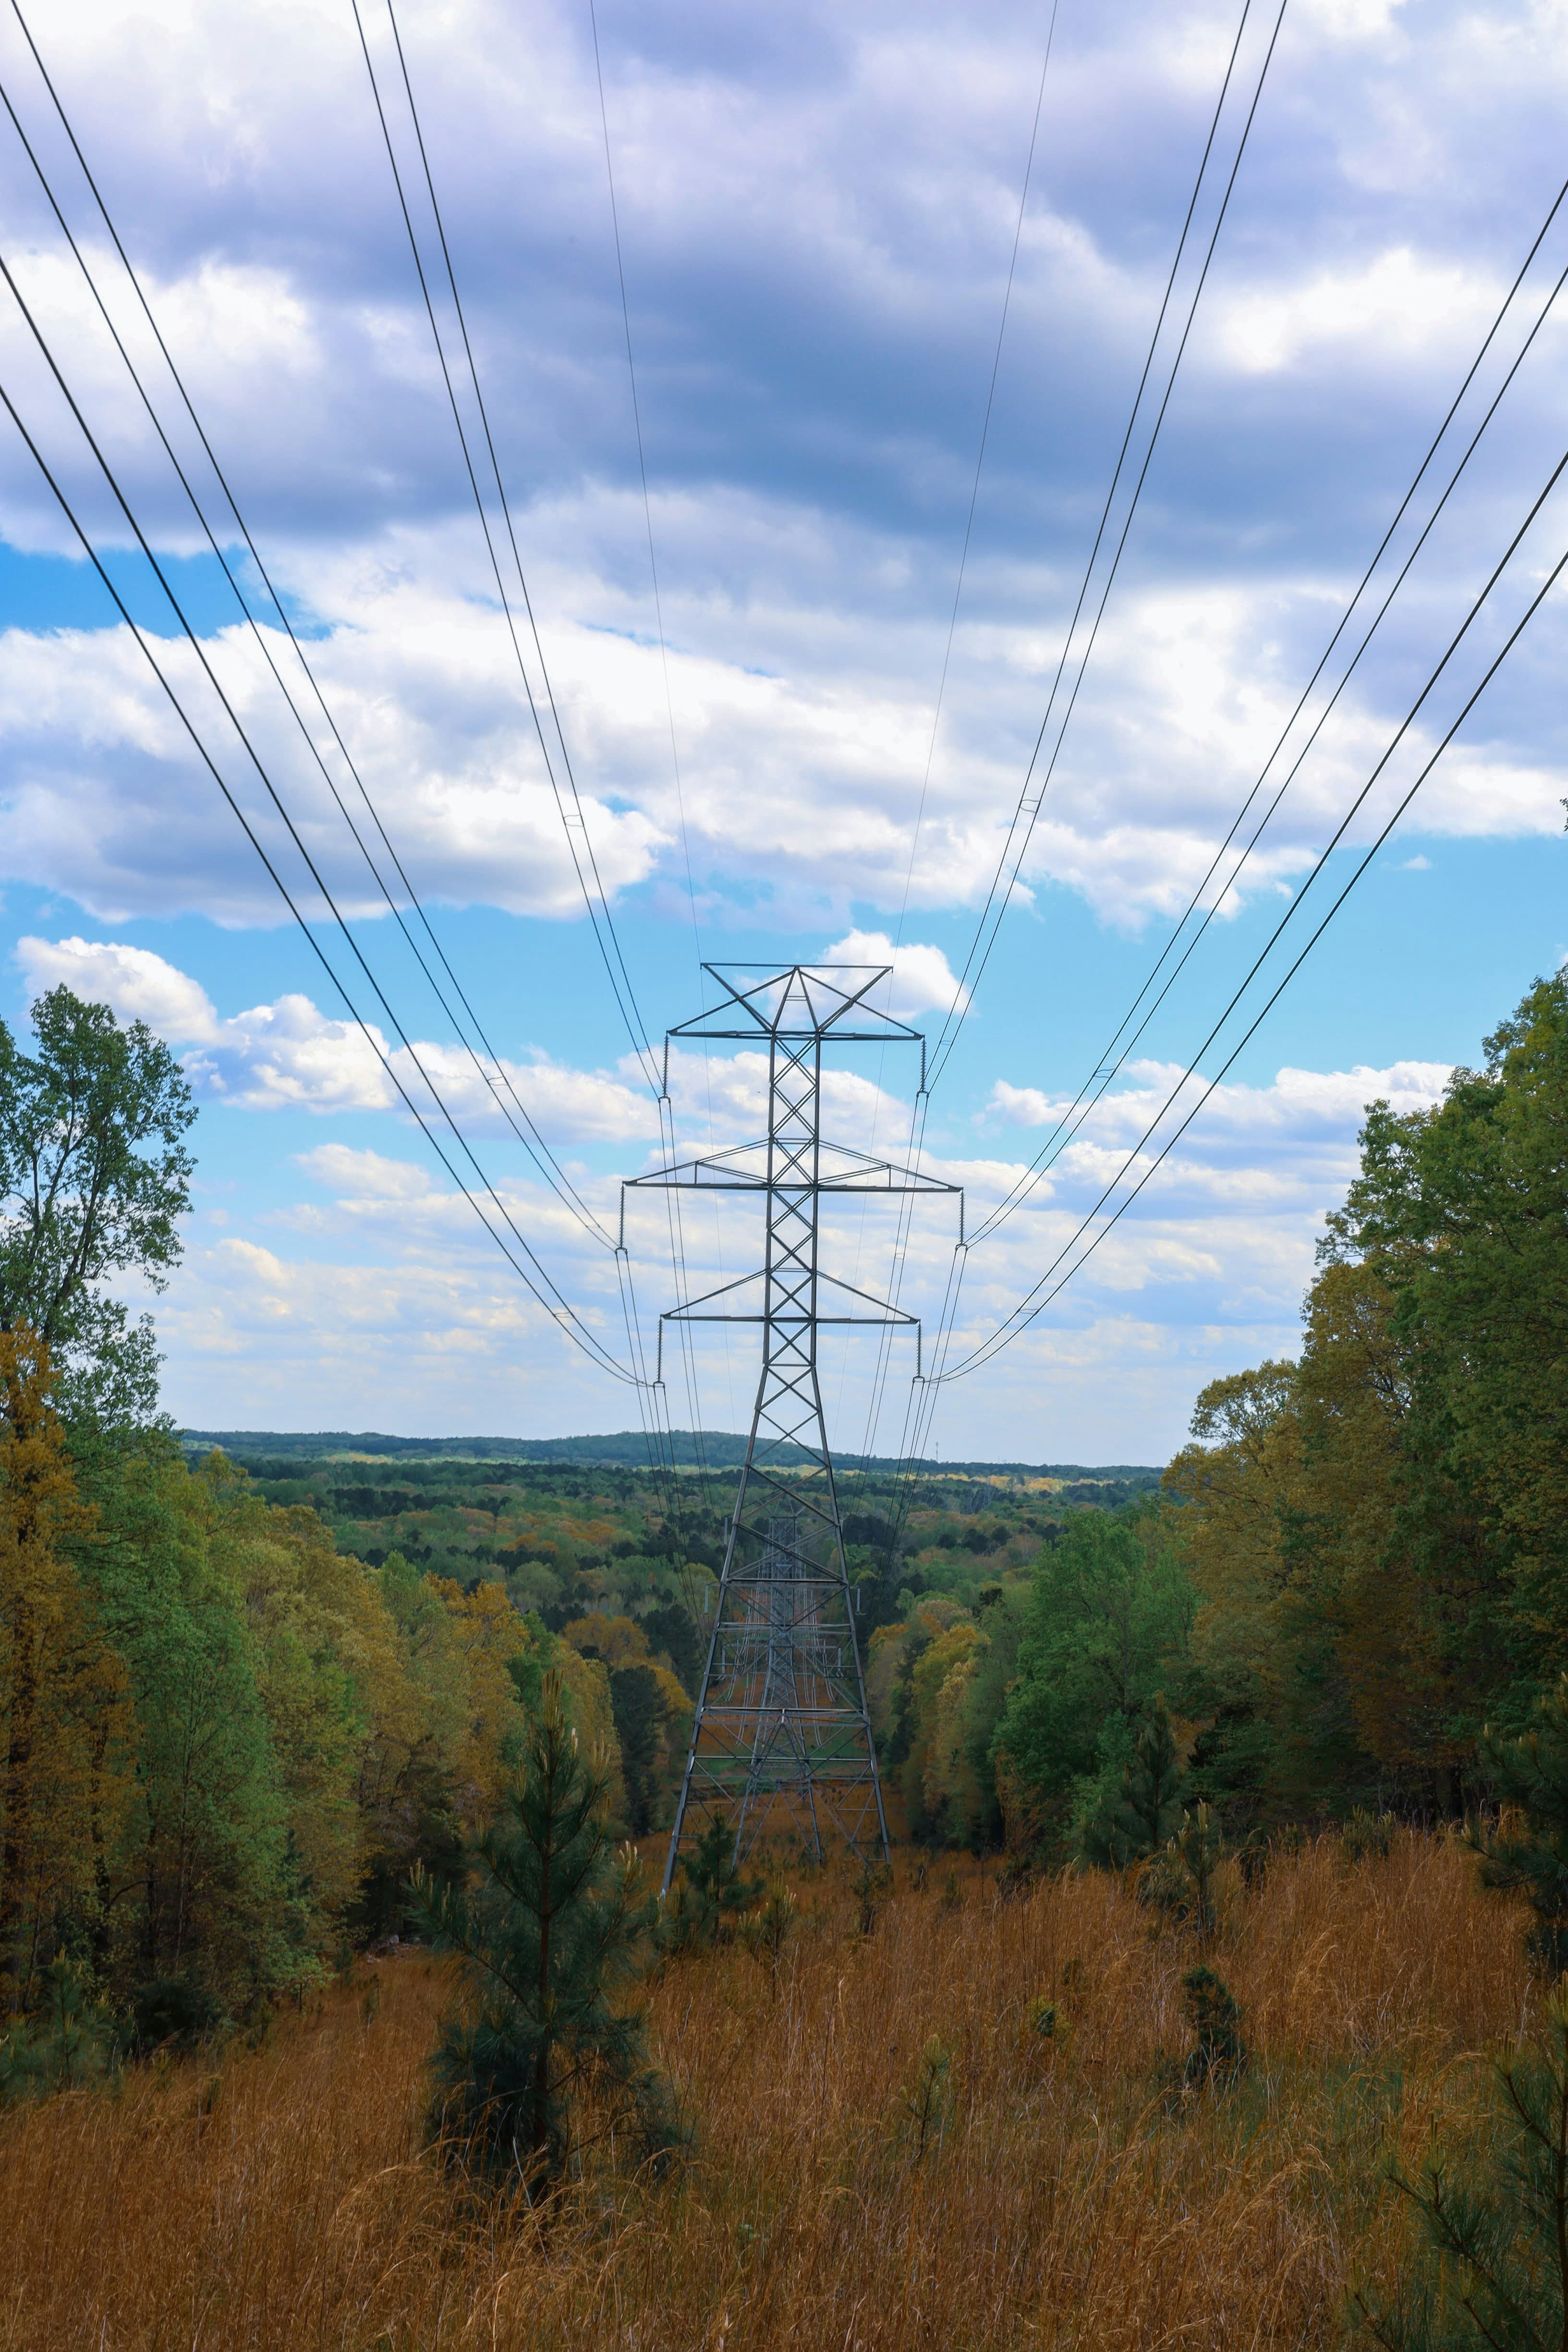
Utilities

Assisting PSPS type scenarios, segmented risk, impact to nearby values, and the workflows you can rely on.

Learn more

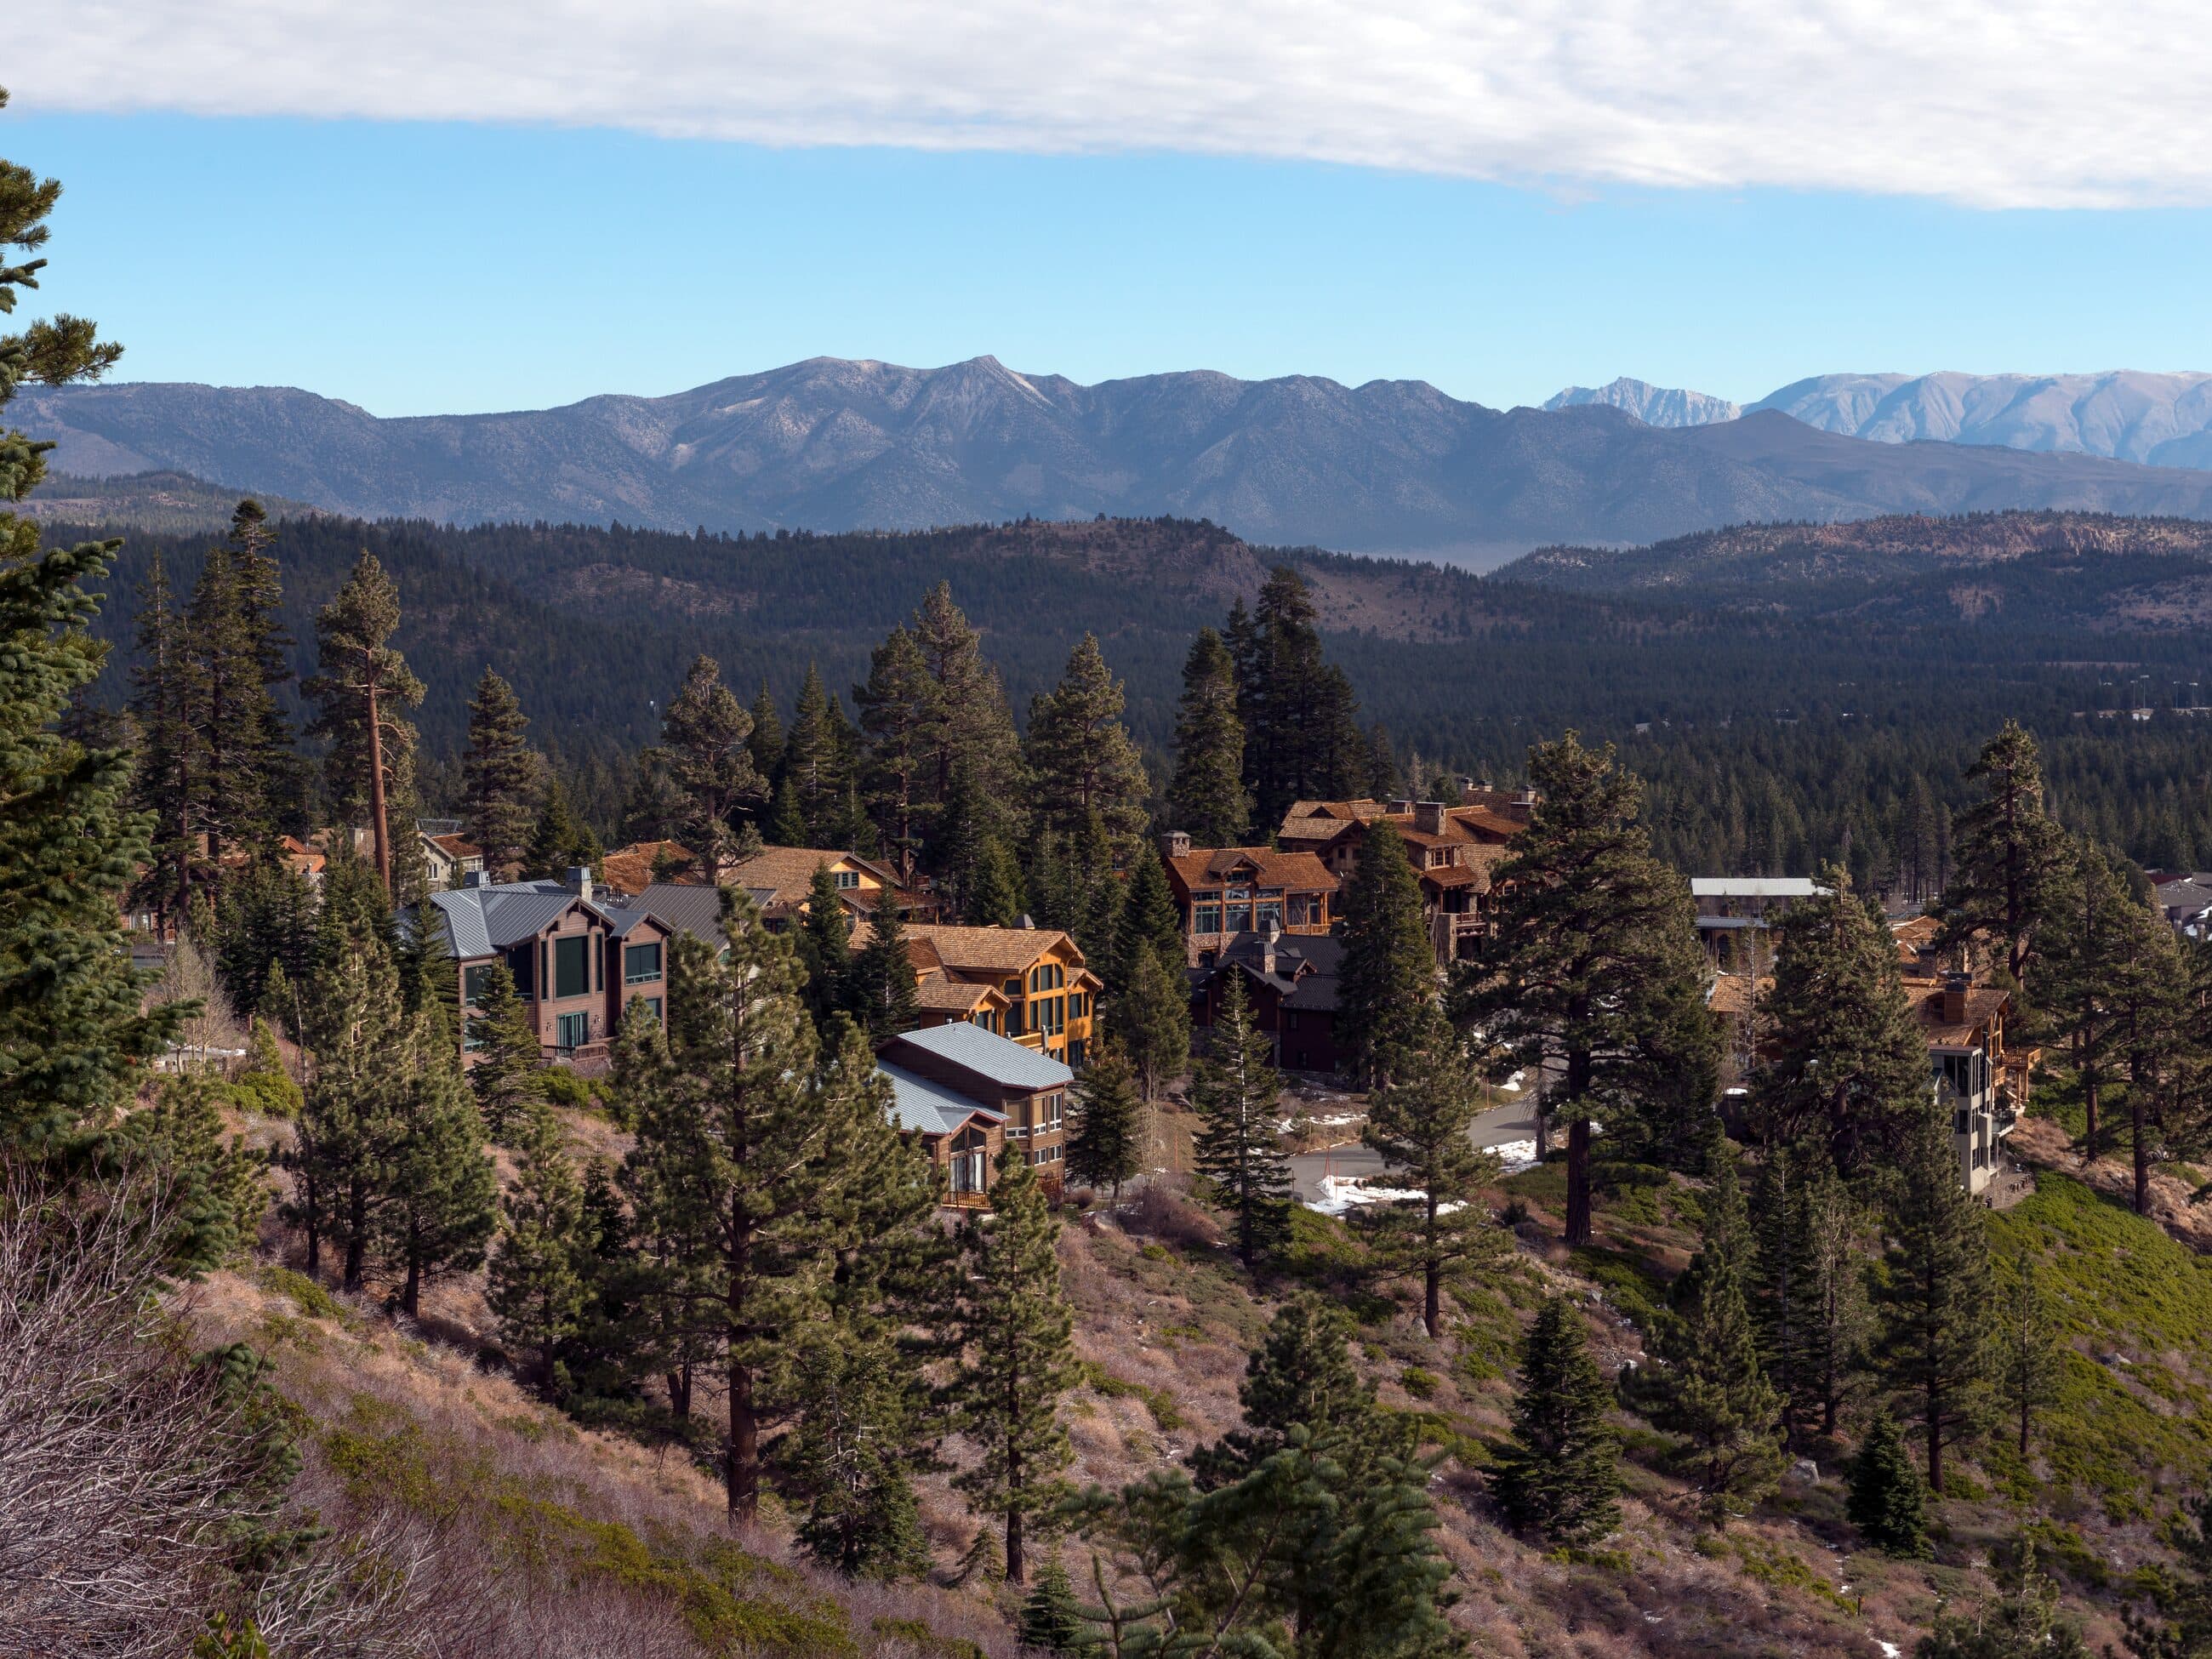
Communities

Wildfire risk for towns, counties, and fire departments, measured by the homes a modeled fire could reach.

Learn more

Insurance

Wildfire modeling that can inform insurers assessing homes, buildings, and communities in fire country.

Learn more

The product

Risk, resolved across your assets.

Each segment is scored on a multitude of factors including historical, current, and forecasted weather, fuel status, terrain, nearby fire activity, and the structures exposed by modeled ignitions. Narrow in on your critical areas.

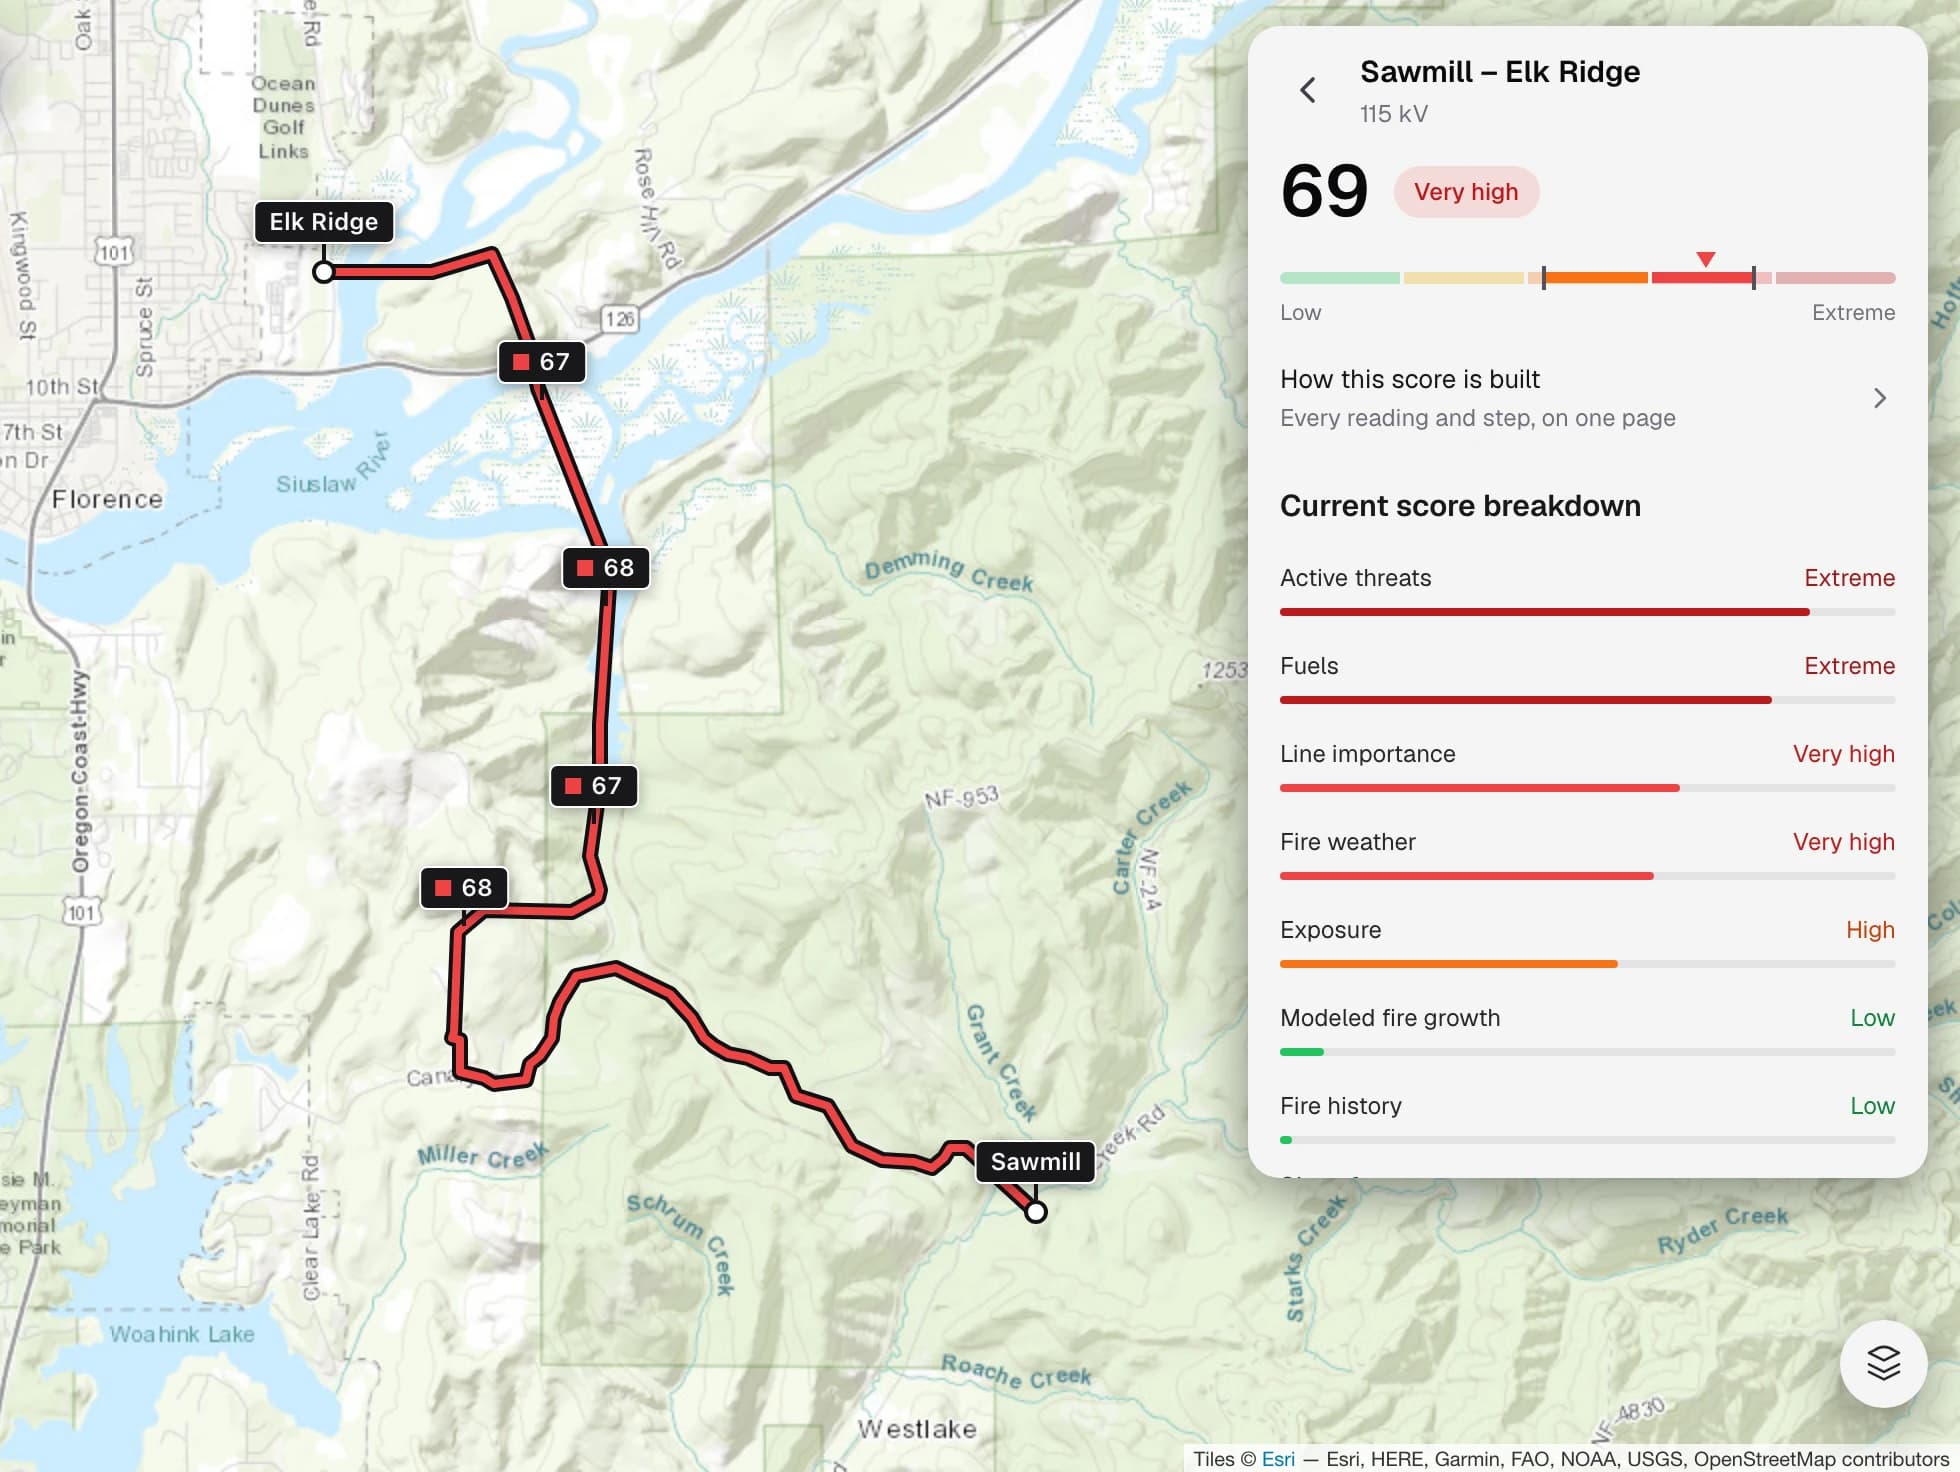
One transmission line open in Flarecast, scored 69 and rated very high, with its seven risk factors listed beside a map of the line.
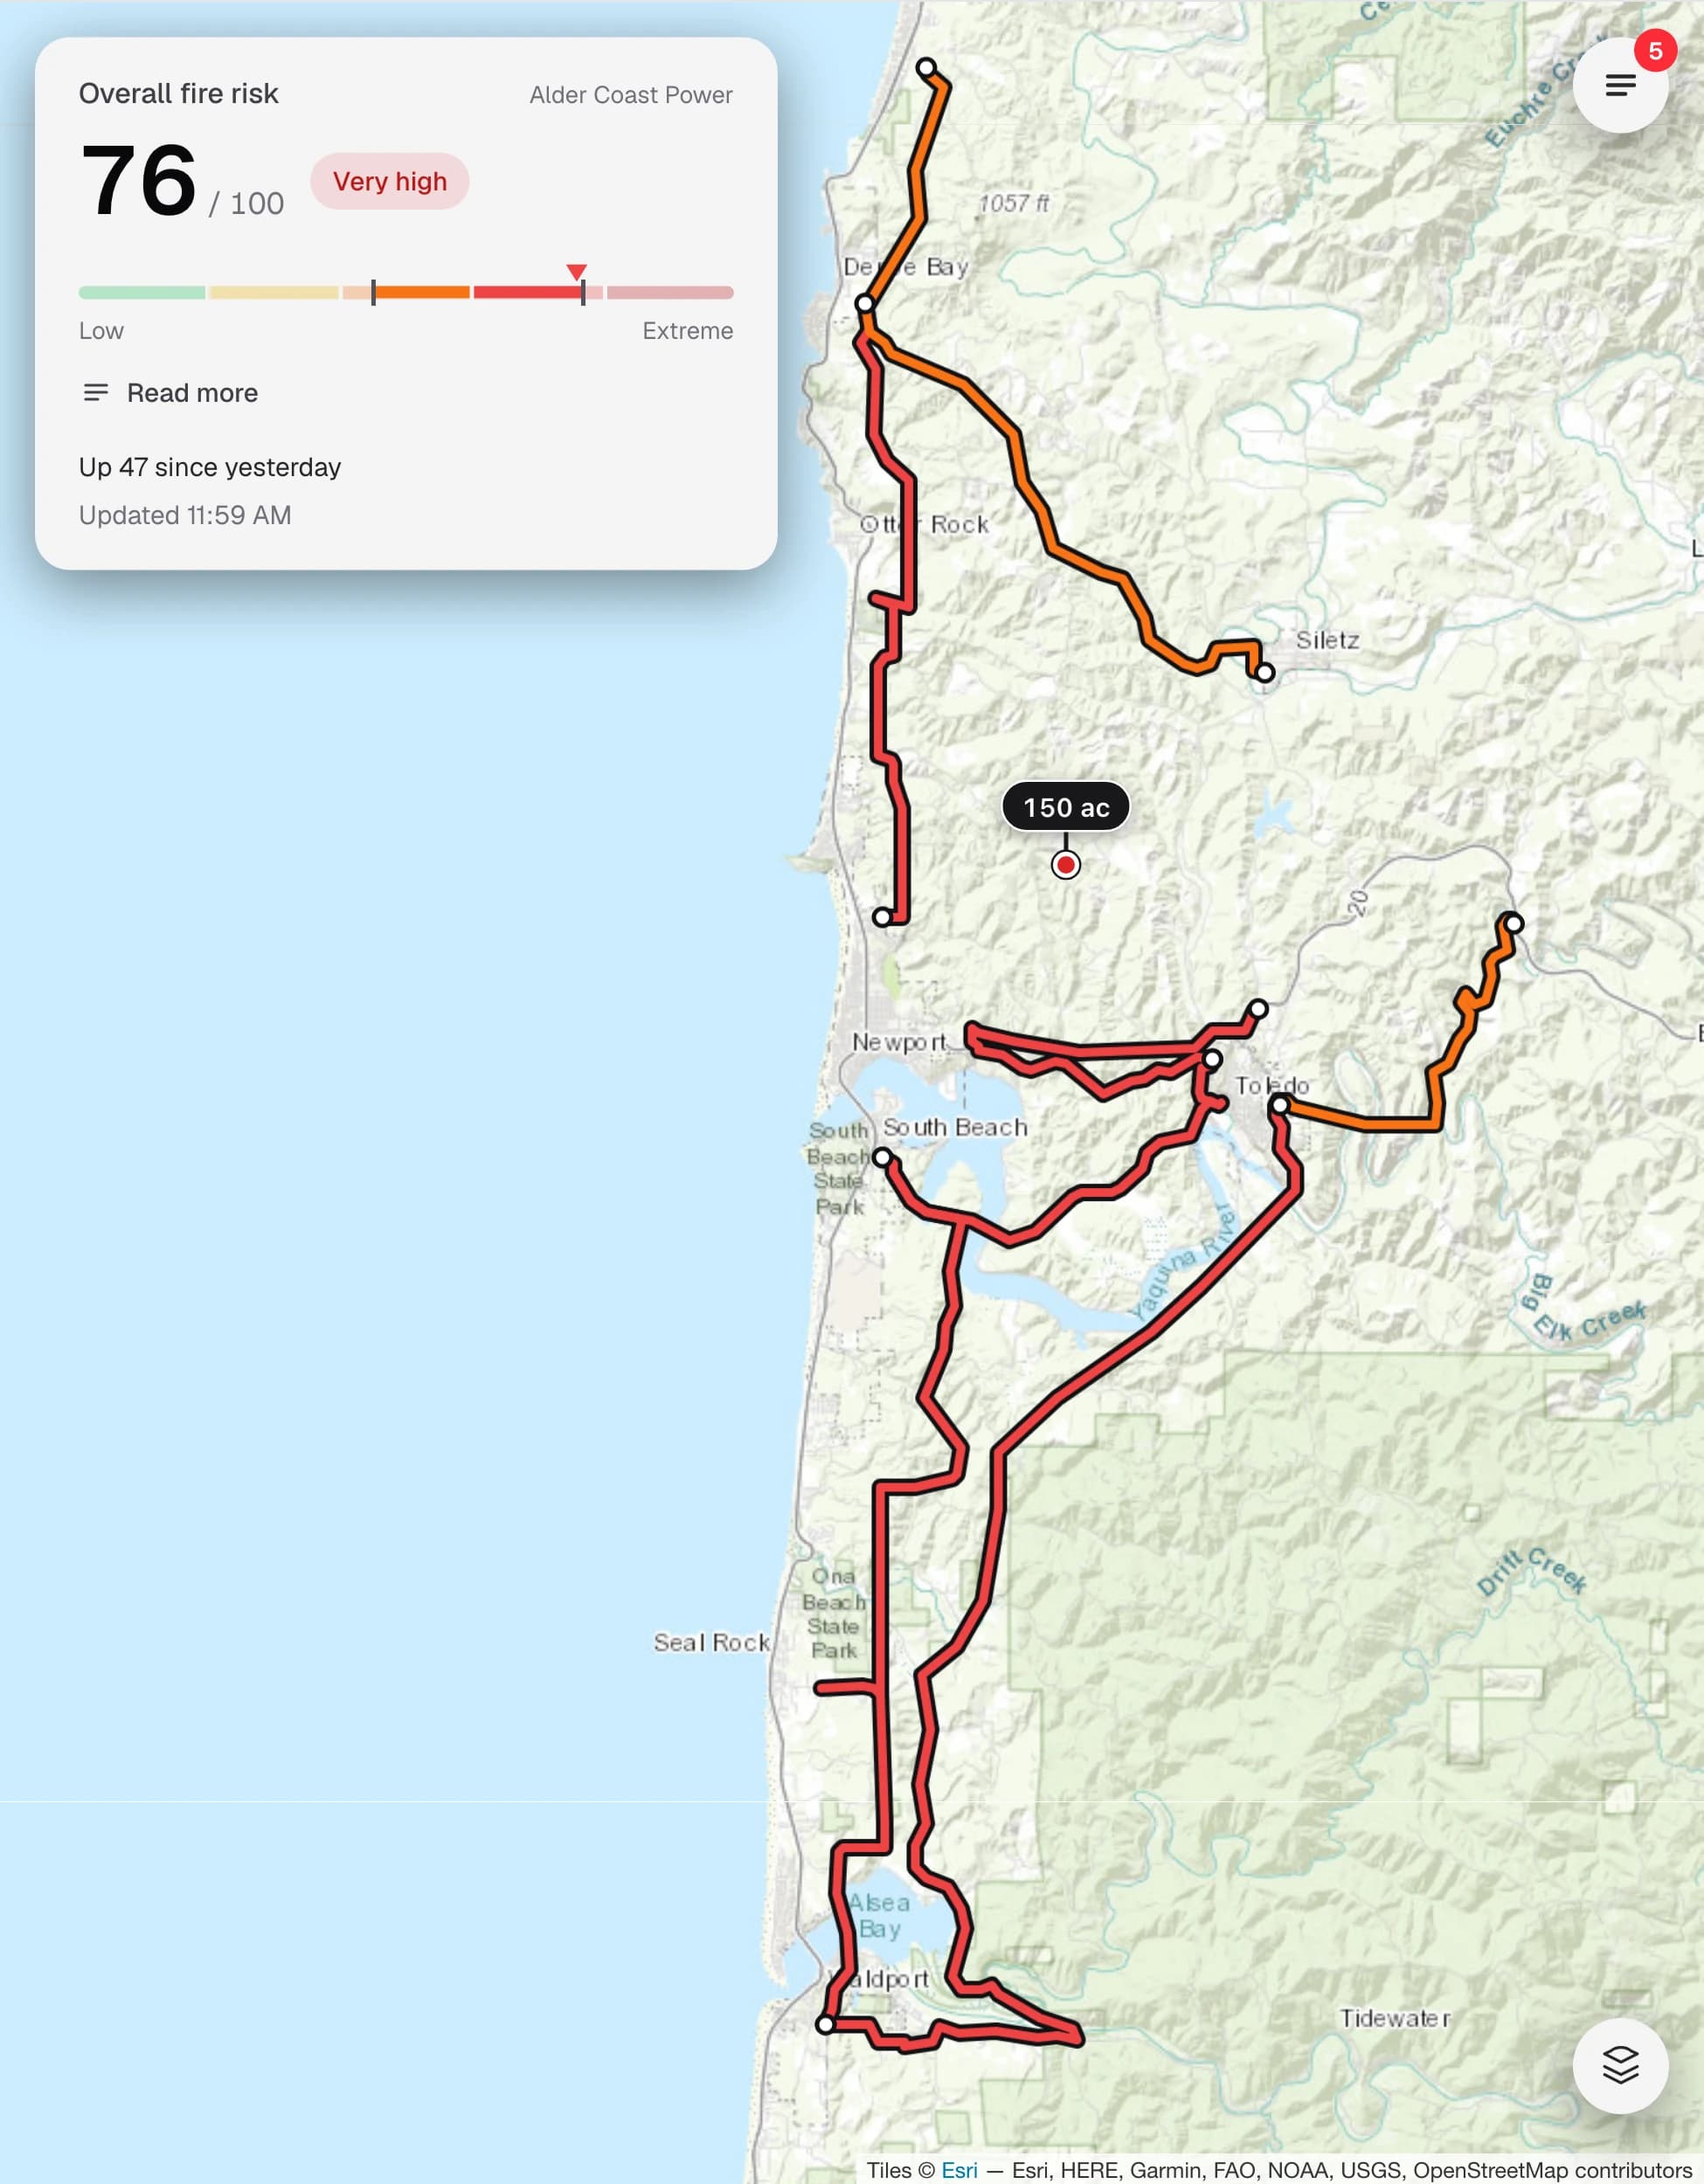
The Flarecast home screen: an overall fire risk score of 76 out of 100, rated very high, above a map of the utility's lines coloured by risk.
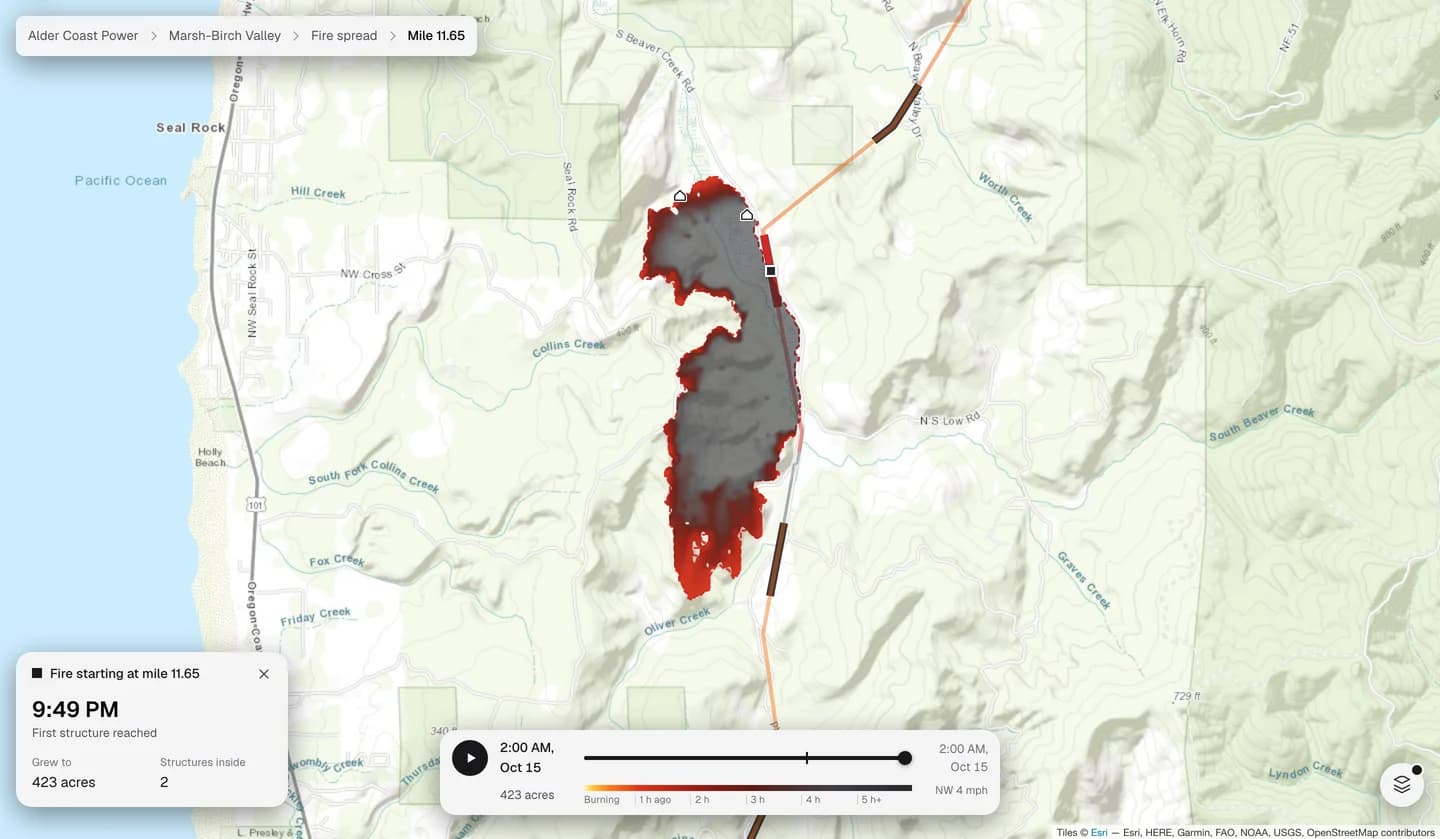
Flarecast playing back one modeled fire that starts beside a power line at mile 11.65: from 1:00 PM to 2:00 AM it grows to 423 acres, burned ground turning grey behind an orange front, and reaches 2 structures.

Fire growth modeling

Modeled wildfire growth along your assets.

Flarecast models wildfire ignitions at regular intervals across your infrastructure.

Play back wildfire spread
View the modeled spread hour by hour, interactively on the map.
Ember risk
Flarecast also models where embers could land, at a range far past the fire front.
Structures at risk
View the structures that each simulated fire exposes to damage, and the estimated time of arrival at each structure from the time of ignition.
See all features

Validation

Backtested on 1.2 million fire weather days sampled across the US

We scored locations on real power lines, in each of the US fire regions, totalling nearly 1.2 million fire weather days. We also collected a large fire database and scored each ignition on the day it ignited.

Read the methodology
  • Started by utility equipment
  • Other large fires
Large fires by the risk score on the day they ignited. Most sit in High and above; 38% fall in Extreme, including 63% of the fires started by utility equipment.LowModerateHighVery highExtreme045627482100

Features

Real-time risk scores, fire simulations, live fire tracking, alerts, and locked daily records.

Learn more
Flarecast

About Flarecast

Who built this, and why.

Learn more

Contact Flarecast

Tell us about your operation and we’ll be in touch to arrange a live demo.

All fields are required

Your organization *

By submitting this form you agree to be contacted by Flarecast about your request.